National Home Visiting Resource Center
- Research
- Strategy
- UX
- Wireframes
- Data Visualization
A digital yearbook of national and local home visiting data
The National Home Visiting Resource Center releases a 270 page annual yearbook to present a comprehensive picture of home visiting data on a national and state level. However, the printed copy was difficult to distribute effectively and wasn’t practical for casual users. The online PDF was cumbersome to navigate and was locked into a chapter-like structure that didn’t utilize the flexibility and accessibility that is possible digitally.
Optimized for a Digital Experience
For 2019 and onward, we restructured the yearbook into a digital format—one that was flexible and accessible to readers who don’t have time to consume the full yearbook. Plus, a fully digital yearbook is easier to update for the National Home Visiting Resource Center—so rather than recreating a printed book each year, the team could simply import updated data themselves and make small adjustments to the written content as needed.
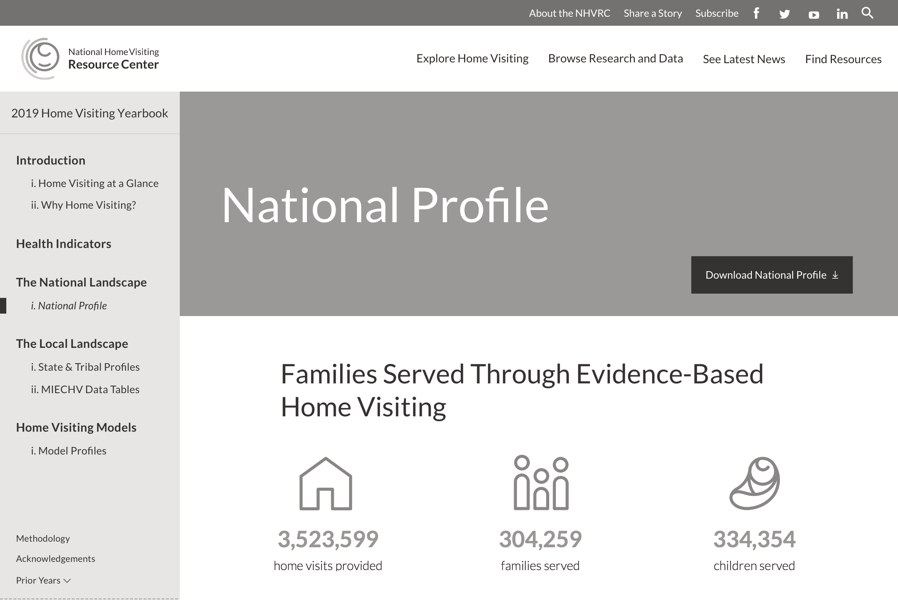
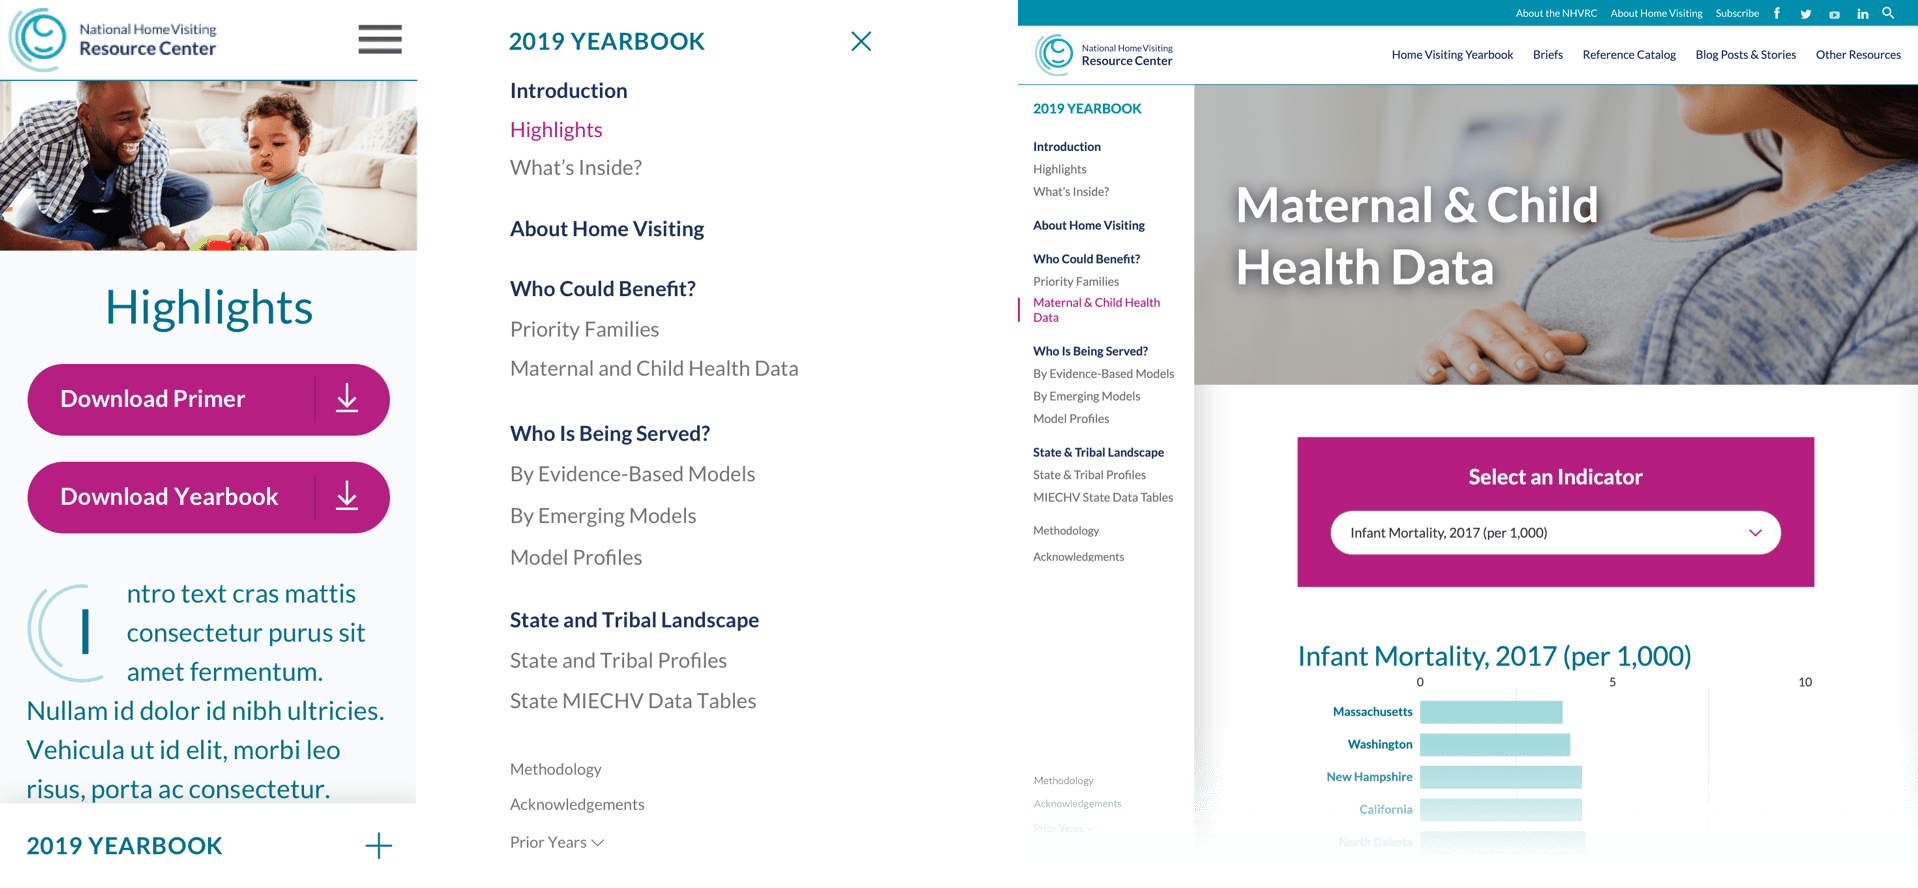
User-driven Exploration
Rather than forcing readers into a linear format, the digital yearbook includes an ever-present, clear navigational structure that lets the user view the information that is most relevant to them. We consolidated content that was repetitive in the book and separated lengthy explanation from the data visualizations. This way, data wouldn’t be buried by pages of written content and would be easy to access to repeat visitors. We updated labels to be more clear to newcomers, but we maintained enough of the original language so the transition wouldn’t be too jarring for past users.
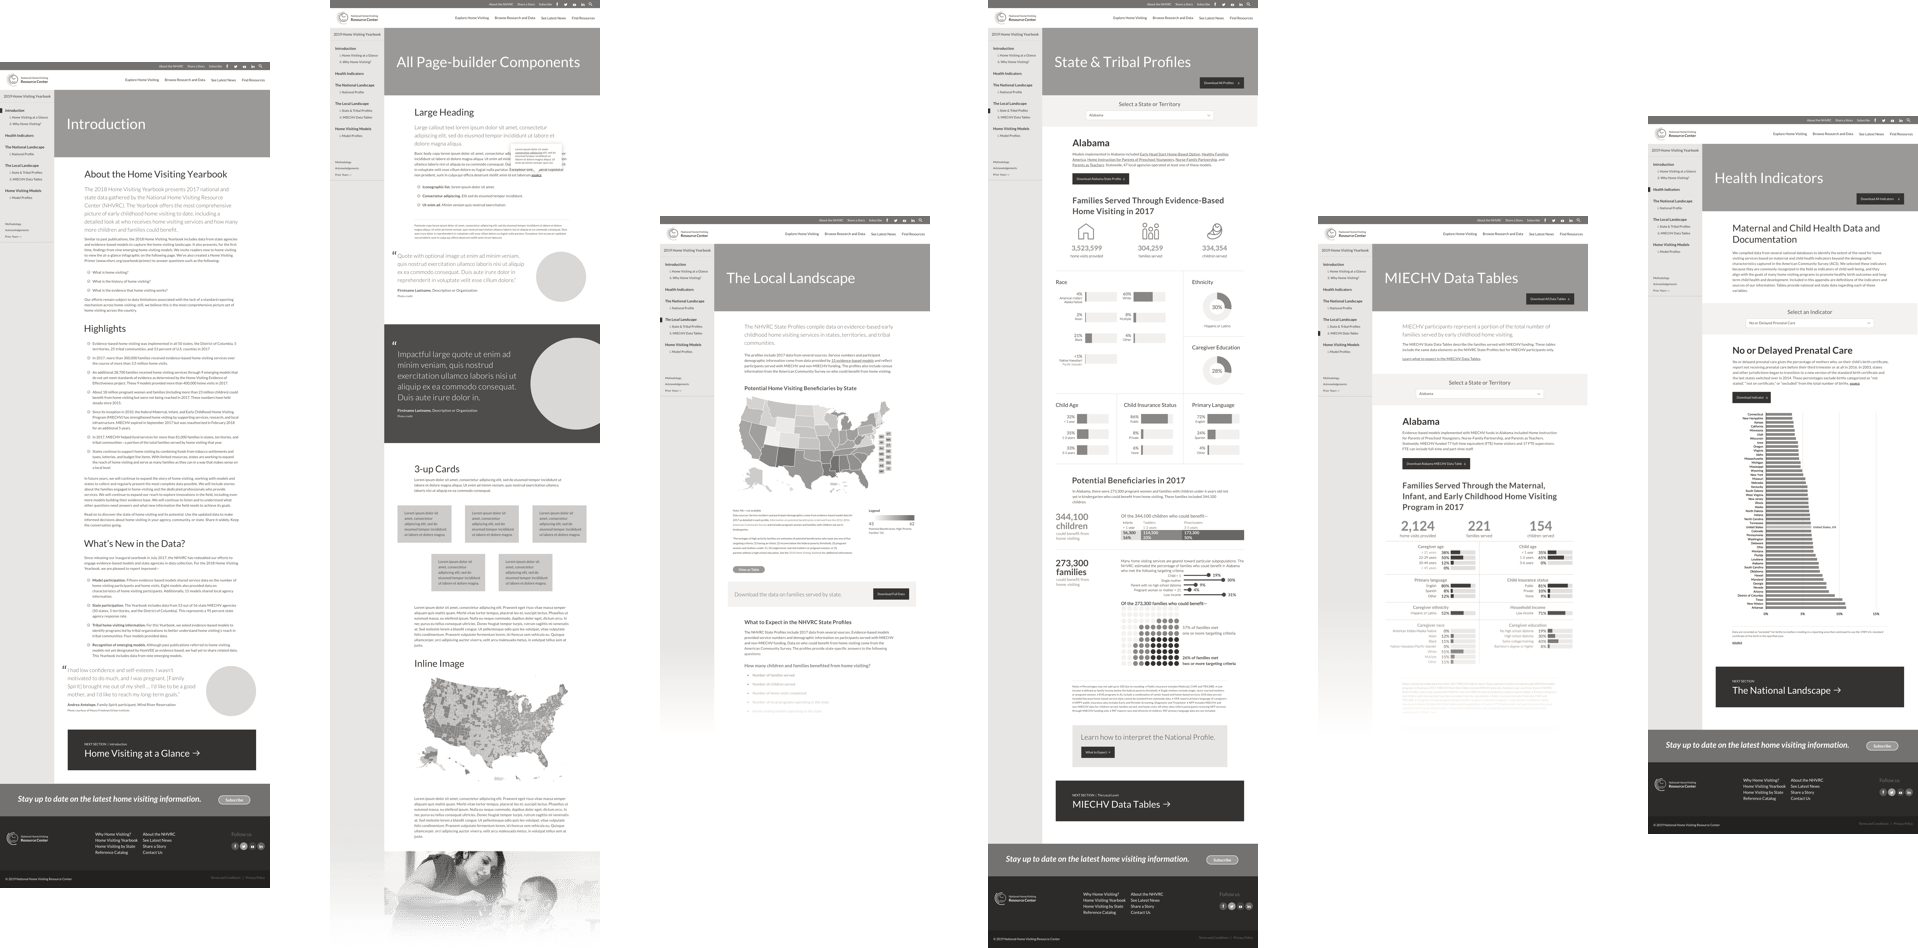
Customized Components for Storytelling
A set of flexible components allowed NHVRC to tell the long-form story within the yearbook with compelling visuals. Each page also includes optional download buttons, so that users who want to save the information can download PDFs of the information related to each page.
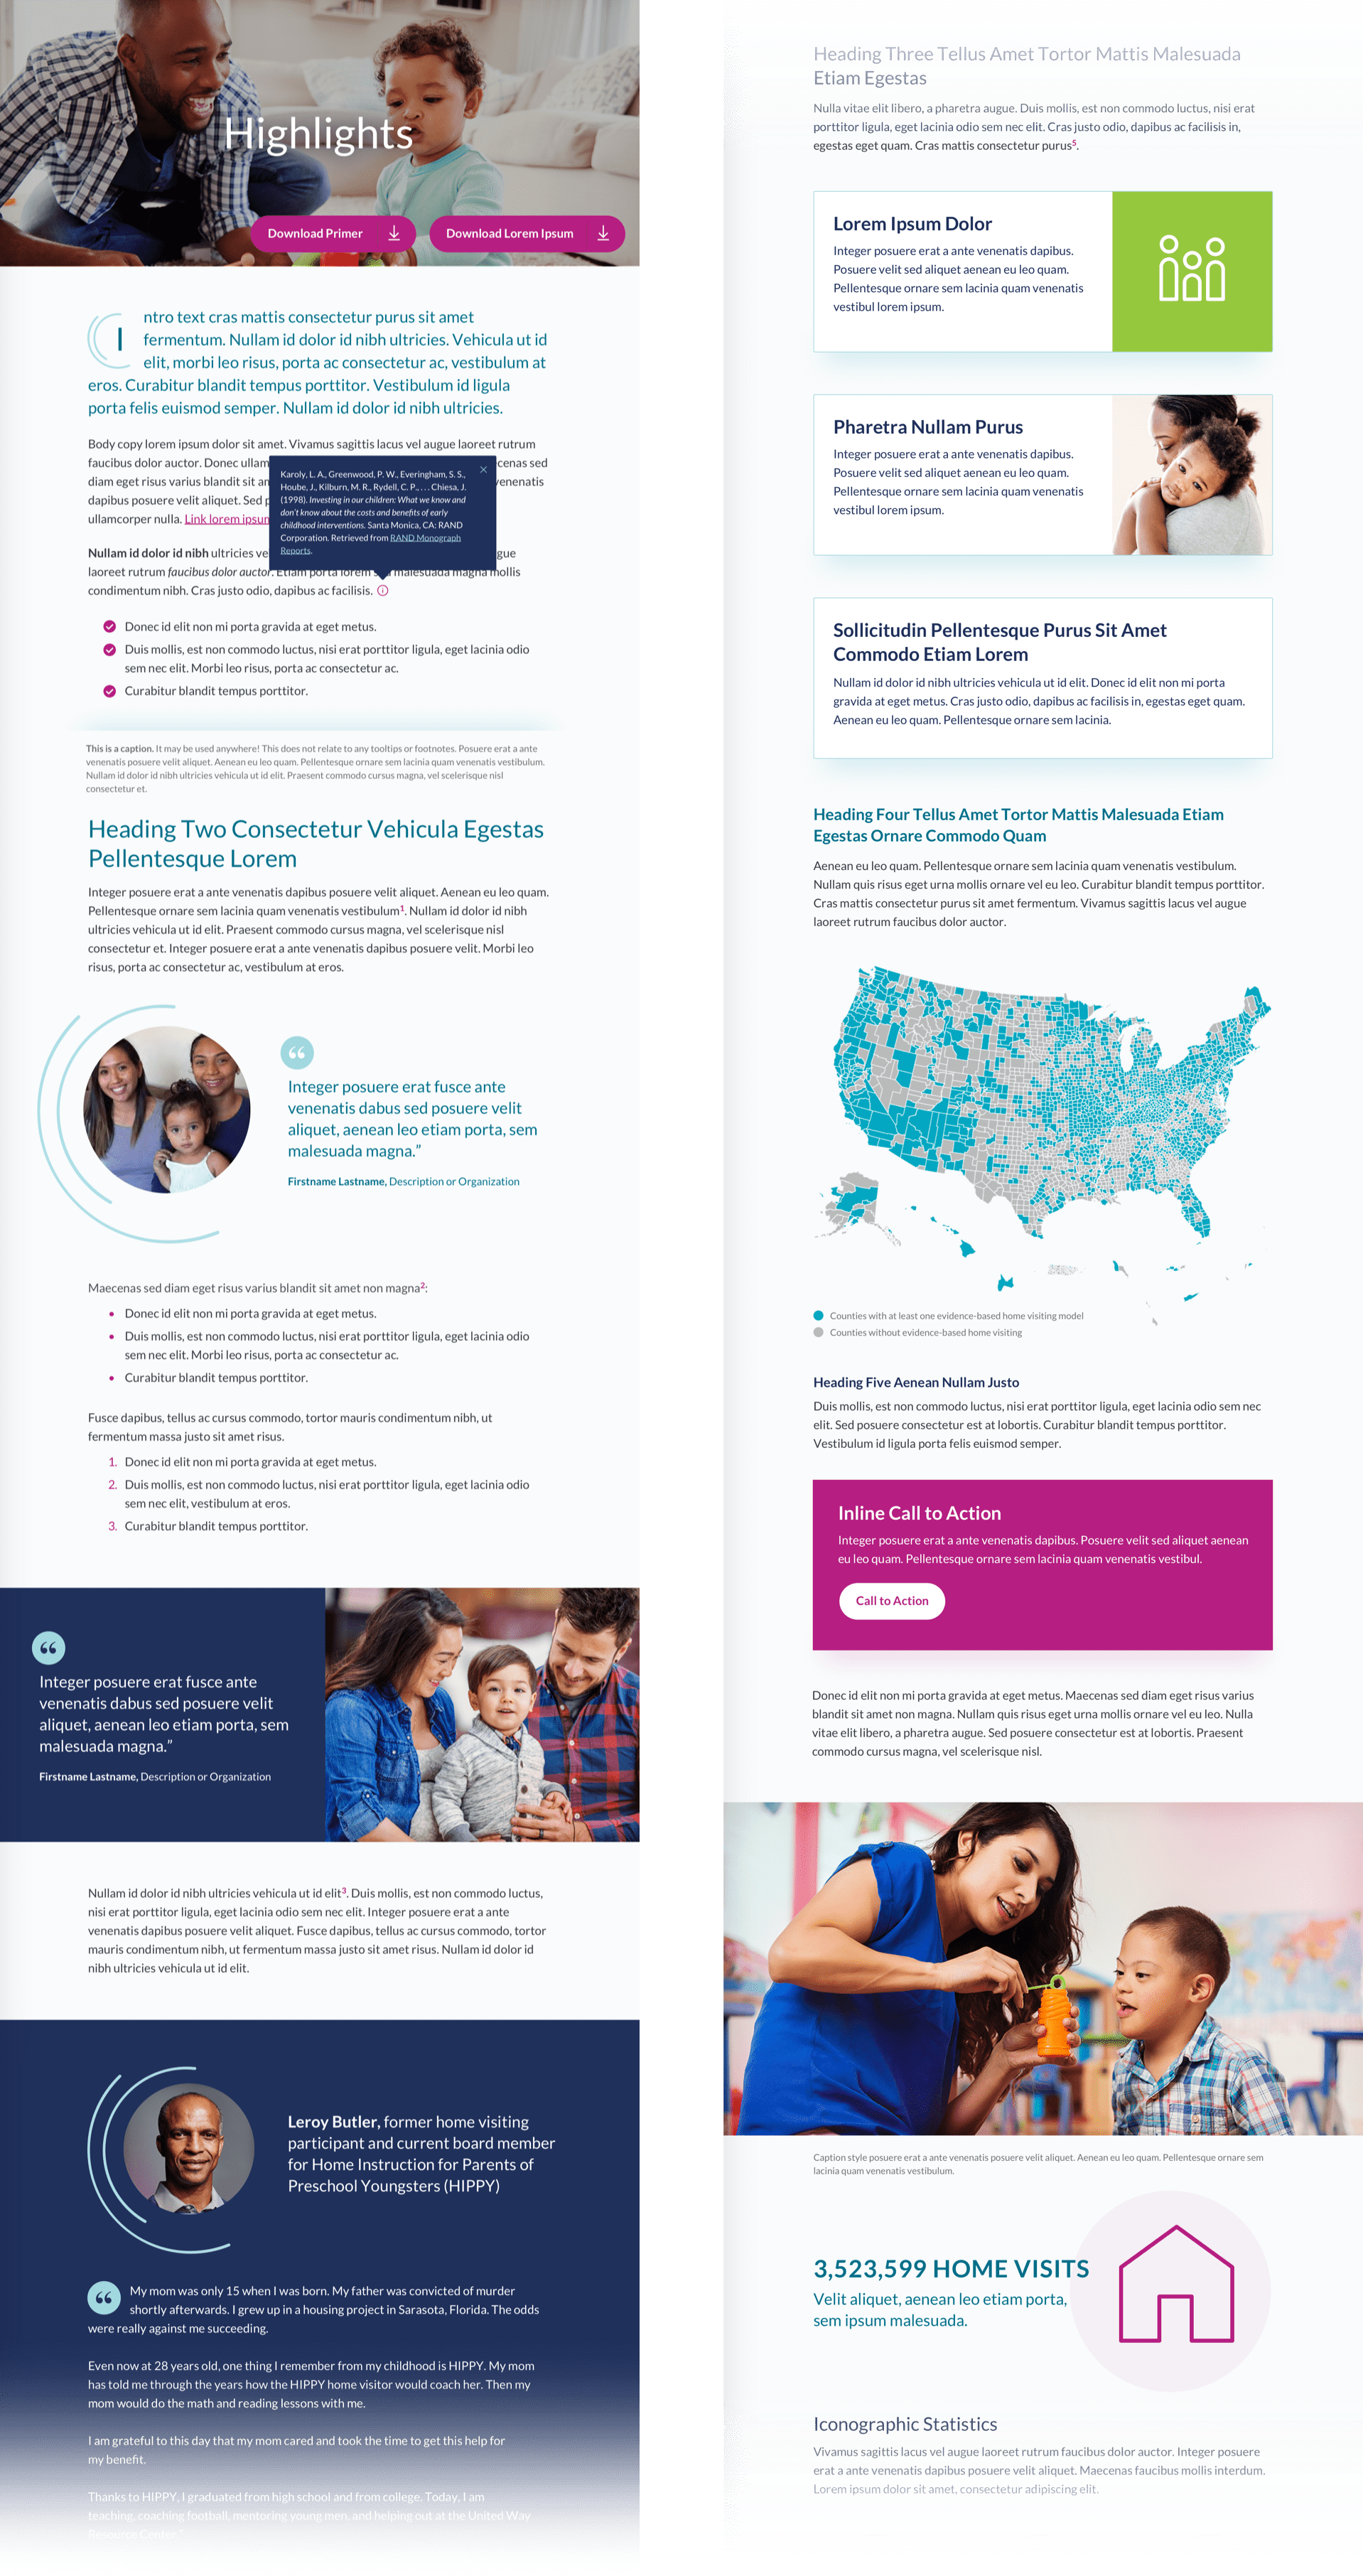
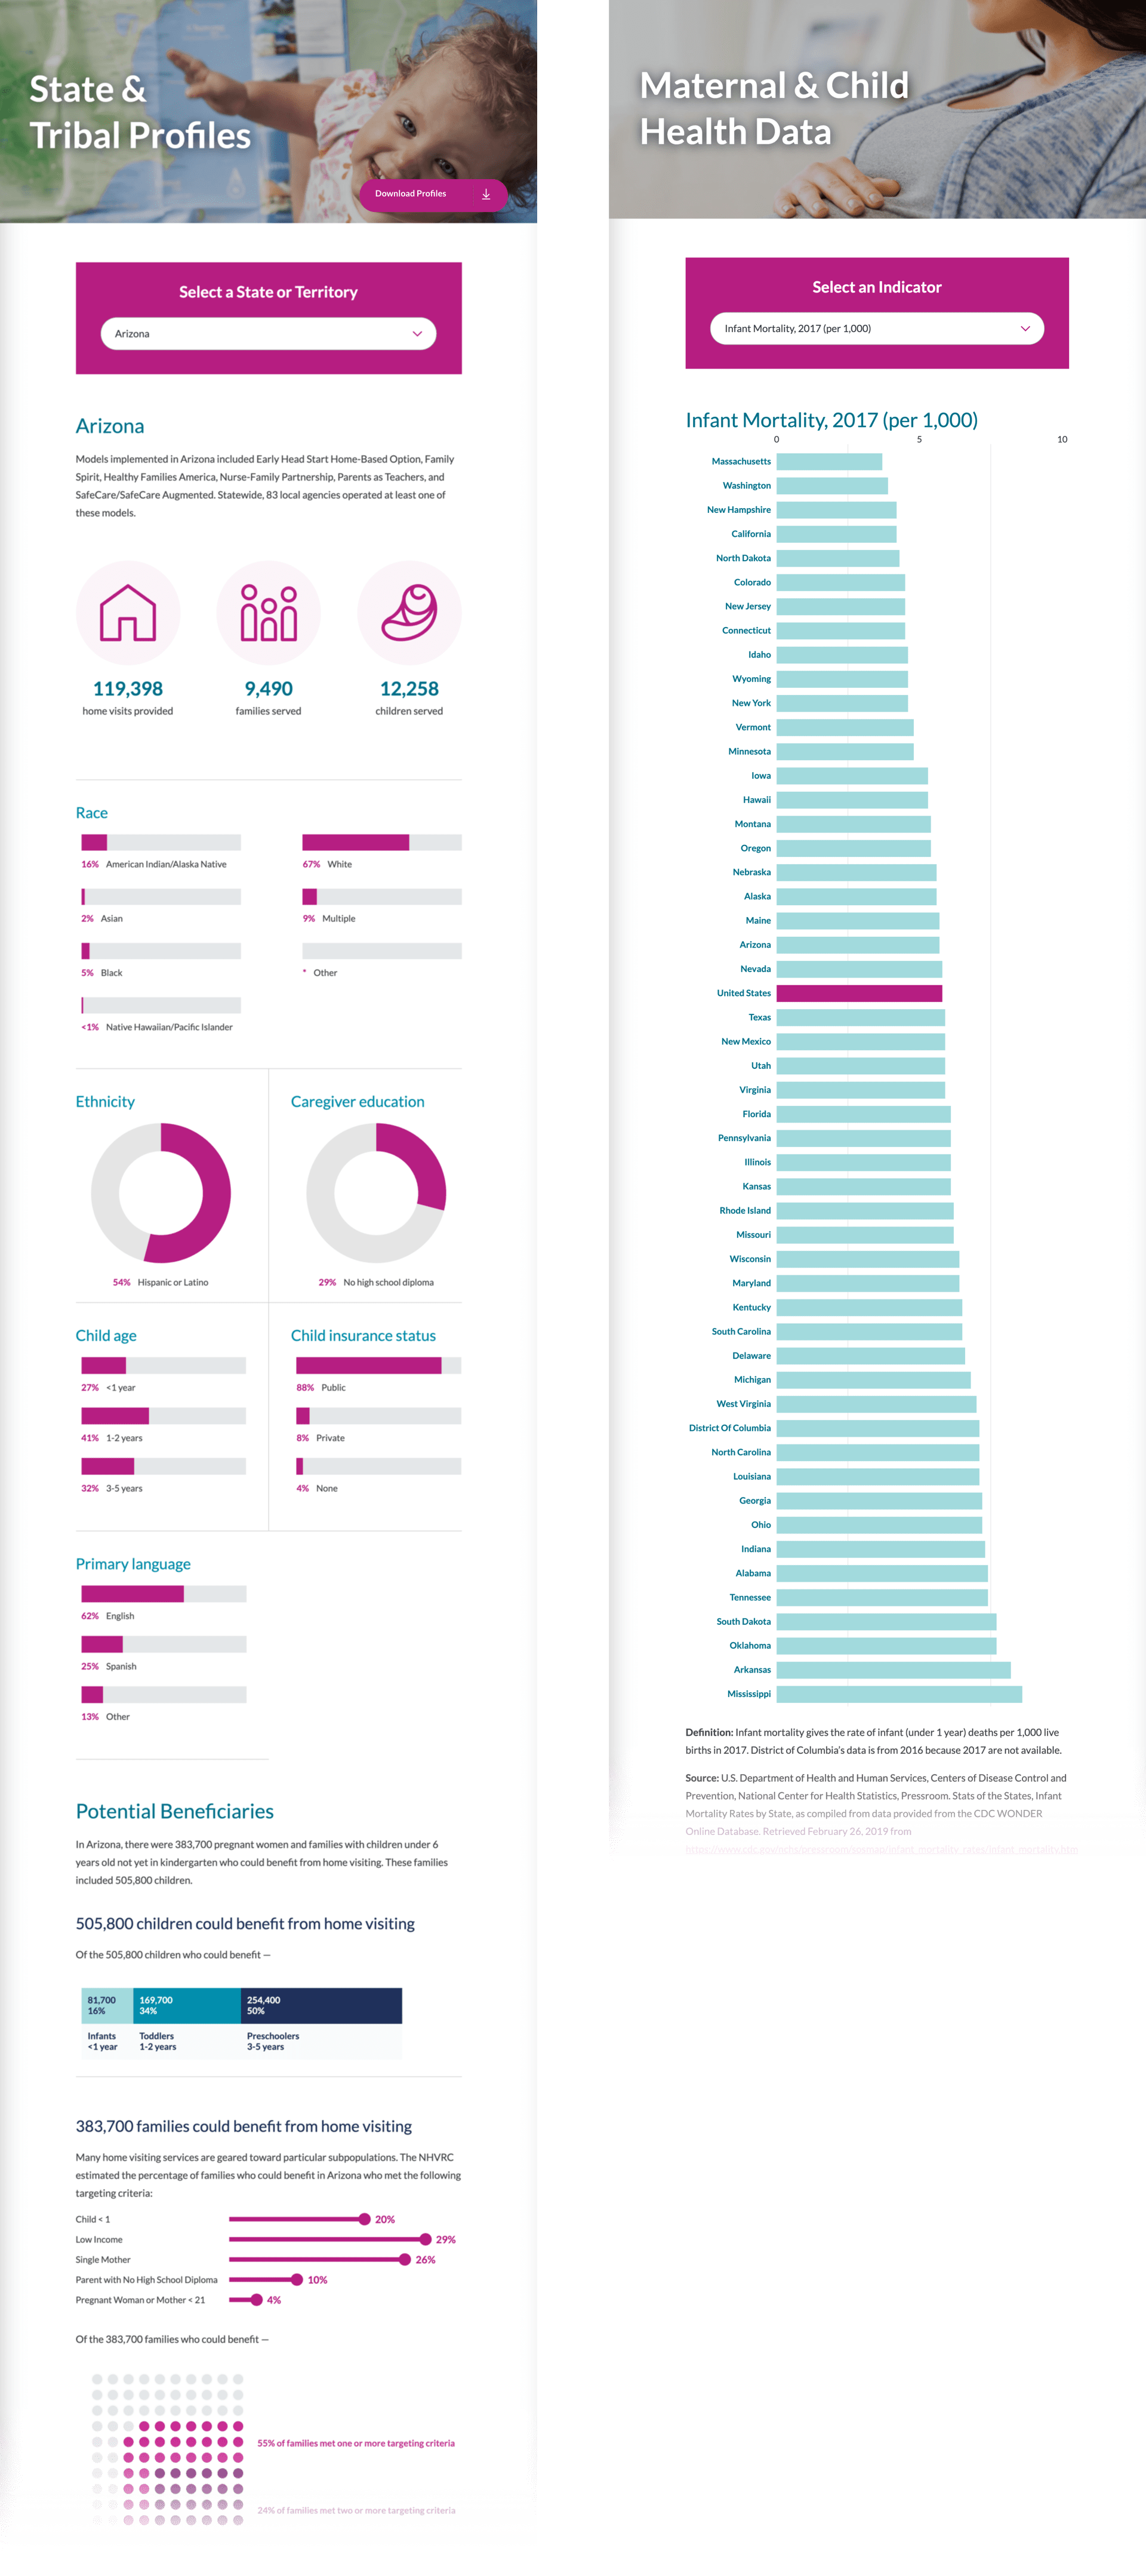
Charts Structured for Flexibility & Growth
We consolidated the types of charts and data visualizations from the printed version into a consistent set for the digital yearbook—and maintained enough variety for all of the data to be represented accurately and maintain visual interest.
The charts were built with flexibility and growth in mind to make maintenance easy for NHVRC. Each year, they just need to upload a .csv with new data and match it to the corresponding line items in the CMS—the correct chart types and styles are displayed automatically. We aimed to future-proof the charts by allowing for missing or hidden data in case collected metrics change over the years.
A Thorough CMS Guide
Because the yearbook typically only needs to be recreated once a year, we created a thorough CMS guide to train the client on how to upload new data and use the flexible page-builder components. They can refer to the guide each year or refer new staff members to the guide when it’s time to make updates.
About the Project
You can view the full version of the digital yearbook here.
Client
The National Home Visiting Resource Center, via James Bell Associates.
Project Team
This project was created during my time at Threespot.
Research, Strategy, and User Experience Design—Meryl Pritchett
Visual Design—Jamielyn Smith
Development—Ted Whitehead
Project Management—Ben Mills & Lizzy Cederberg